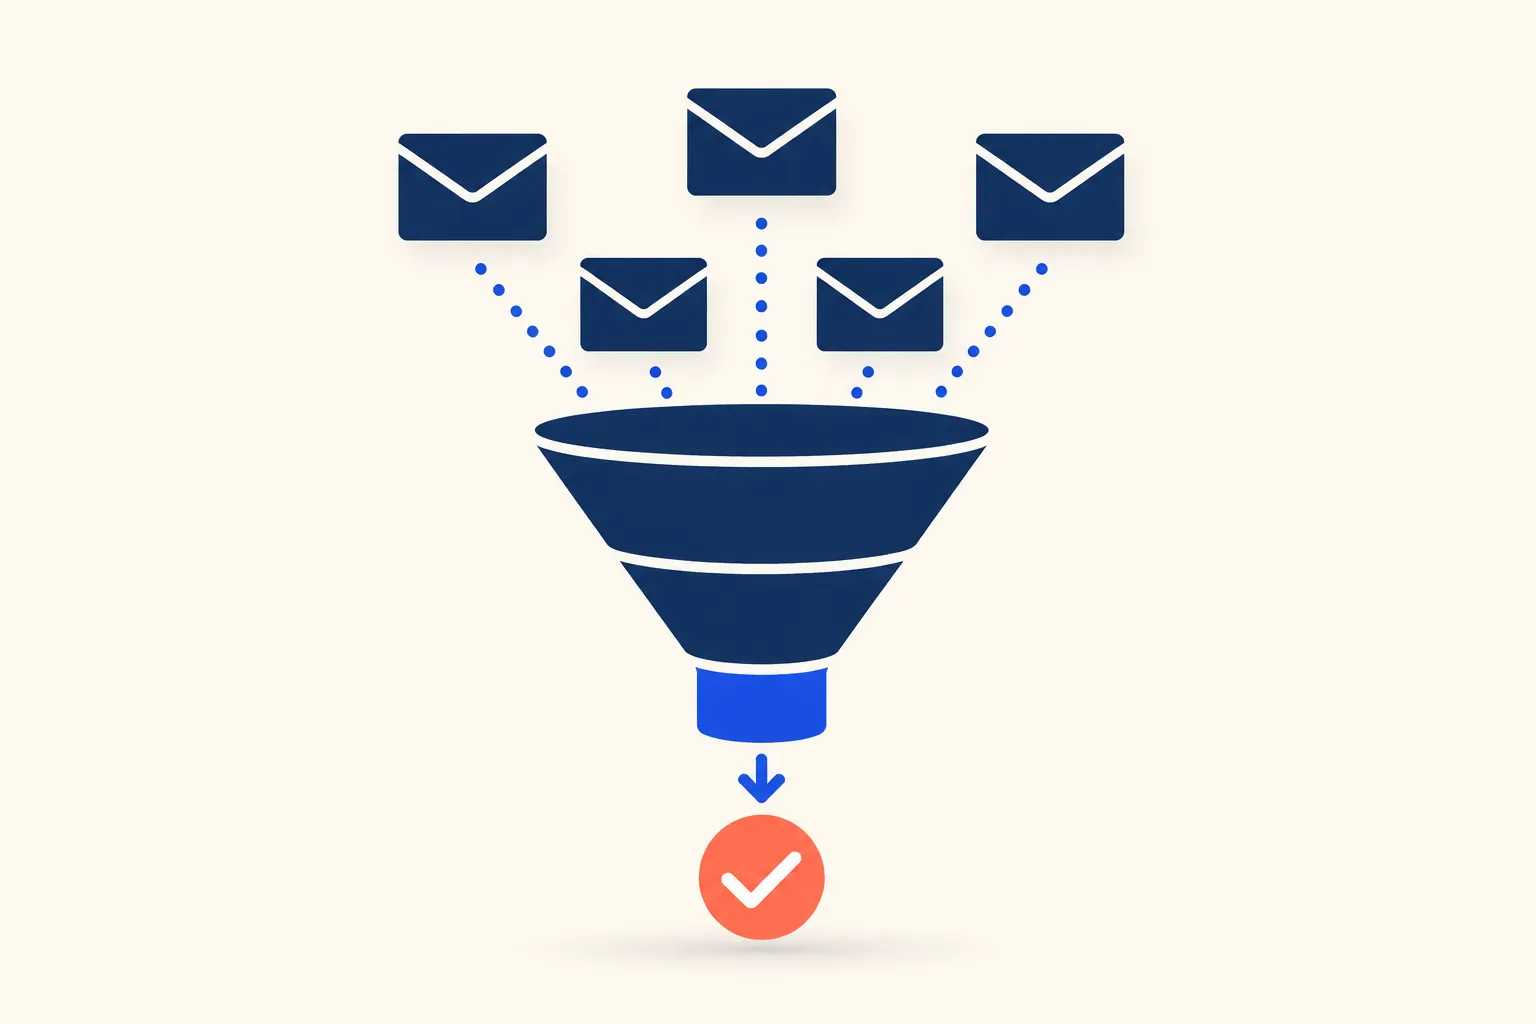
Email conversion rate is the percentage of delivered emails that result in a completed action, calculated as (conversions ÷ emails delivered) × 100. HubSpot defines that action as a recipient who clicks a link “and complete[s] a desired action, such as filling out a lead generation form or purchasing a product.” That’s a stricter bar than email click-through rate, which only counts the click, not what happens after it. A campaign can post a 10% CTR and still convert at 2%, because getting someone to click is a different problem than getting them to finish checkout or submit a form. Conversion rate also sits downstream of deliverability: a message that never reaches the inbox has no chance to convert, however well it’s written.
The Email Conversion Rate Formula
Two formulas circulate, and they use different denominators.
HubSpot’s version, delivered base:
Conversion rate = (conversions ÷ emails delivered) × 100
Campaign Monitor’s version, opened base:
Divide your number of conversions by the number of opened emails, then multiply that number by 100.
Same conversions, different base, different published rate. A worked example shows the gap.
You send a campaign to 10,000 delivered addresses. It gets 4,200 opens, 350 clicks, and 150 conversions.
- Delivered-base conversion rate: (150 ÷ 10,000) × 100 = 1.5%
- Opened-base conversion rate: (150 ÷ 4,200) × 100 = 3.57%
Same campaign, more than double the reported rate depending on which formula your dashboard uses. Before comparing your numbers against a published benchmark, check which base that benchmark uses. HubSpot’s own worked example uses 400 conversions against 10,000 delivered emails for a 4% rate, the same delivered-base method used above.
Email Conversion Rate vs. Click-Through Rate
Click-through rate and conversion rate measure two different steps in the same funnel, and the relationship between them is a simple multiplication:
Conversion rate = CTR × click-to-conversion rate
Using the numbers above: CTR is 350 ÷ 10,000 = 3.5%. Click-to-conversion rate, the share of clickers who complete the action, is 150 ÷ 350 = 42.9%. Multiply those and you get 3.5% × 42.9% = 1.5%, matching the delivered-base conversion rate calculated earlier.
This split tells you where to look when a rate disappoints. A low conversion rate with a healthy CTR is a landing-page or offer problem, not an email problem, since the click already happened. A low conversion rate with a low CTR is a targeting or subject-line problem, since not enough of the right people opened the message at all.
| Metric | What it measures | Typical denominator |
|---|---|---|
| Open rate | Recipients who opened the email | Delivered emails |
| Click-through rate | Recipients who clicked a link | Delivered emails |
| Conversion rate | Recipients who completed the goal action | Delivered or opened emails, varies by source |
Average Email Conversion Rate Benchmarks
Klaviyo’s 2026 benchmark report tracks what it calls “placed order rate,” its term for the share of recipients who complete a purchase after a send:
| Send type | Average placed order rate | Top 10% of senders |
|---|---|---|
| One-off campaigns | 0.16% | 0.36% |
| Automated flows | 2.11% | 4.30% |
Flows win by a wide margin because they fire on behavior, not a calendar. Klaviyo reports flow-based emails deliver “3x higher click rates (5.58% vs. 1.69%) and 13x higher placed order rates than campaigns.” Teams weighing platforms for this kind of flow-based sending can compare Klaviyo alternatives. An abandoned-cart email sent 30 minutes after someone leaves checkout competes with almost nothing else in the inbox; a weekly newsletter competes with everything.
Barilliance’s breakdown of e-commerce trigger types shows how much the specific trigger matters within automated sends: browse-abandonment emails convert at 4.10%, cart-abandonment emails at 18.54%, and “Email My Cart” messages, sent after someone adds an item without starting checkout, at 24.58%. The pattern holds across all three data sets: the closer the trigger sits to an existing purchase intent, the higher the conversion rate.
Why Conversion Rate Tracking Breaks Down
Two tracking problems distort email conversion rate before you even calculate it.
Open-based metrics are inflated. Apple Mail Privacy Protection preloads every message on Apple’s proxy servers, firing the open-tracking pixel whether or not the recipient reads the email. Postmark notes that these false opens “don’t click links,” which is why an opened-base conversion rate calculation can understate performance for any list with a meaningful Apple Mail audience. Click and conversion data aren’t affected the same way, since a proxy server loading an image doesn’t click a link or complete a purchase.
Attribution windows differ by platform. Klaviyo’s default attribution window is 5 days for email clicks and 5 days for email opens, using a last-touch model that credits the most recent qualifying message. Widen that window and older campaigns start claiming credit for conversions a newer email actually drove; narrow it and multi-touch journeys lose credit entirely. Before comparing conversion rate across tools or campaigns, confirm both are using the same window length.
Tagging links with UTM parameters keeps at least the initial attribution consistent regardless of which tool measures it downstream. Google’s guidance recommends setting utm_medium=email and a distinct utm_source per send so email traffic doesn’t get folded into referral or direct traffic in your analytics.
Tactics That Move Email Conversion Rate
Match the landing page to the email’s promise. If the email offers a specific plan or discount, the click should land on that plan or discount, not a generic homepage that makes the recipient re-find what they clicked for.
Trigger on behavior, not a calendar. The gap between Klaviyo’s 0.16% campaign rate and 2.11% flow rate isn’t really about email quality, it’s about timing. SaaS lifecycle sequences that fire on signup, trial expiry, or in-product events convert because they reach someone at the moment the message is relevant.
Cut friction after the click. Every extra form field or login step between the click and the completed action loses a share of clickers. Pre-fill what you already know about the recipient and keep the post-click action to one step where possible.
Get the subject line right before optimizing anything downstream. A low CTR caps conversion rate no matter how good the landing page is. Subject lines that get opened is the first lever, not the last one.
For SaaS teams building these flows directly into their product, Coldletter’s templating and automation layer lets triggers like signup or trial expiry fire lifecycle emails without maintaining a separate marketing tool.
Frequently Asked Questions
What is a good email conversion rate?
There’s no single universal number. Campaign Monitor states plainly that “a good conversion rate is different for everyone, depending on your brand and the type of email in question.” Compare your own rate against your own history and against benchmarks that use the same base (delivered or opened) and the same send type (one-off campaign vs. automated flow) as your email.
How is email conversion rate calculated?
Conversion rate equals the number of conversions divided by the number of emails delivered, multiplied by 100. Some sources, including Campaign Monitor, calculate it against opened emails instead of delivered emails, which produces a higher percentage from the same underlying numbers. Confirm which base a benchmark or dashboard uses before comparing it to your own.
What is the difference between email conversion rate and click-through rate?
Click-through rate counts recipients who clicked a link. Conversion rate counts recipients who completed the goal action after clicking, such as a purchase or form submission. Conversion rate equals click-through rate multiplied by the click-to-conversion rate, the share of clickers who go on to finish the action.
Why is my email conversion rate much lower than my click-through rate?
This is expected in most campaigns. Clicking a link only shows interest; completing the action requires the landing page, offer, and checkout or form flow to hold up. A wide gap between CTR and conversion rate points to a landing-page or offer problem rather than an email problem, since the recipient already clicked before dropping off.
Does email conversion rate vary between campaigns and automated flows?
Yes, substantially. Klaviyo’s 2026 benchmark report puts the average one-off campaign placed order rate at 0.16% versus 2.11% for automated flows, roughly a 13x difference, because flows trigger on a behavioral signal instead of a calendar date.
How long should an email attribution window be?
It depends on the platform and the sales cycle. Klaviyo’s default is 5 days for both email clicks and email opens on a last-touch model. A shorter window undercounts conversions from longer consideration cycles; a longer window risks crediting an older email for a conversion a more recent one actually drove. Match the window to how long your typical buyer takes to act after a send.

I’ve spent my career building software at scale with a soft spot for email: deliverability, lifecycle campaigns, and getting messages to actually land. I started Coldletter to fix what bugged me about transactional and marketing email tools. I’m based in Vancouver.